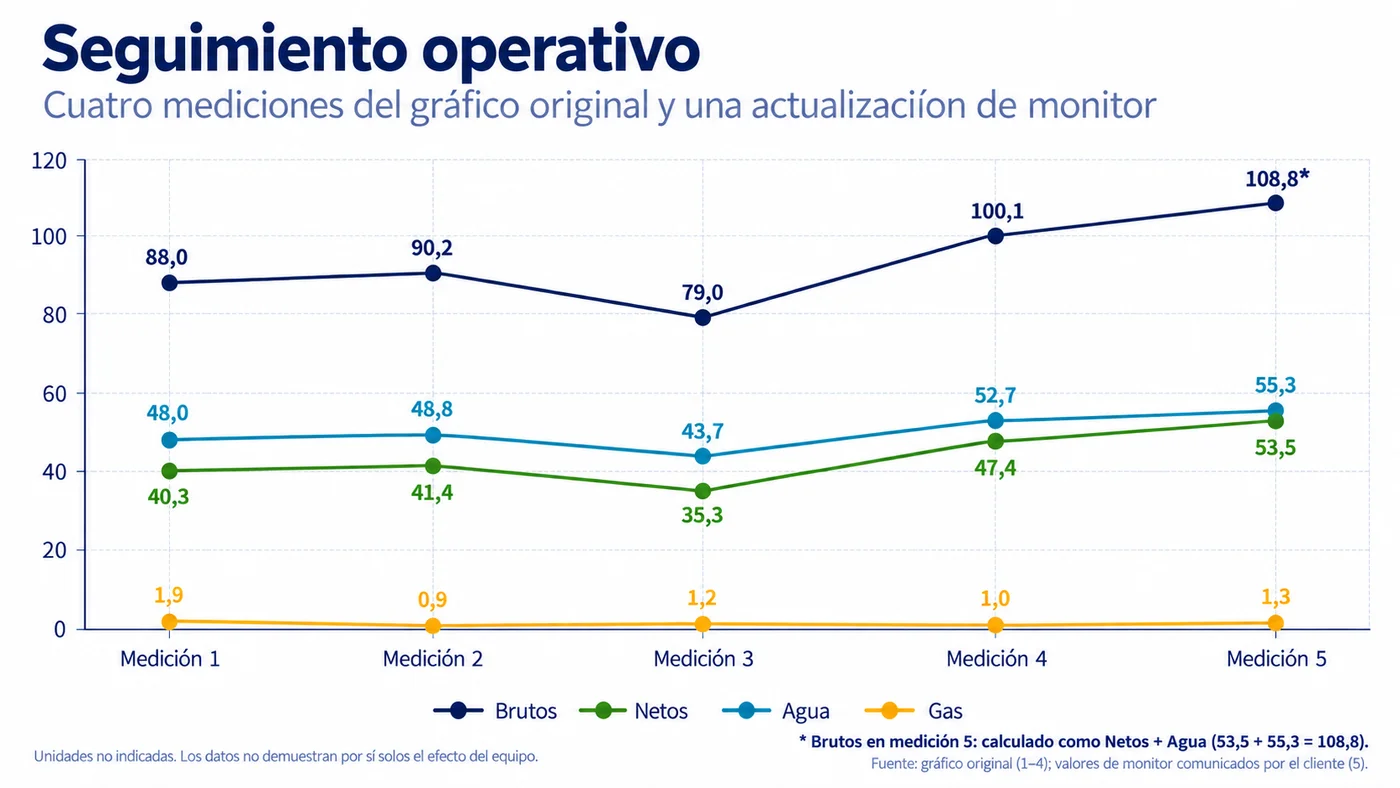
The chart brings together four readings from the original monitoring record and a fifth update reported from the site monitor by the project representative. The original series names are retained to make the figures traceable to the source.
The first four readings show a decline at the third measurement followed by a recovery at the fourth. In the fifth update, the reported values are Netos 53.5, Agua 55.3 and Gas 1.3. Brutos is calculated as 53.5 + 55.3 = 108.8; it is not presented as a separately recorded gross reading.
Units are not specified in the source chart, and the fifth reading’s time period has not been supplied. The figures are therefore presented as reported values rather than a verified production rate. They do not, on their own, establish the effect of EPOD or quantify a reduction in deposits.